Pharmaceutical Methods
Publishing Quality Research & Reviews
Pharmaceutical Methods
Publishing Quality Research & Reviews
Author(s): Kothamasu Pavan Kumar, Chindanuru Swetha, Jerripothula Tejaswini, Vutapalli Sunil Kumar Reddy, Devarakonda Subramanyam, Chinnagollareddy Rupavani, Kothuru Renuka
Background: Tetrabenazine was approved in the year of 2008 by USFDA. It was indicated mainly as an antipsychotic drug but now-a-days it is used for the treatment of hyperkinetic disorders. Objective: The objective of the study was to develop a simple and cost-effective spectrophotometric methods for the determination of tetrabenazine in tablets.
Materials and Methods: The UV-Visible spectrophotometric studies carried out by Shimadzu UV 1800 with UV probe software and FT-IR studies using bruker alpha with opus software. The UV spectrum at 284 nm (Method A) and visible spectrum at 454 nm (Method B) are recorded. The FT-IR band of carbonyl group in tetrabenazine appeared at 1700 cm−1 with two-point baseline between 1650-1750 cm−1 (Method C).
Results: Method A: The UV method was proved linear over the range of 10–50 µg/mL with correlation coefficient r2 =0.9988 and mean recovery of 99.02% to 101.54%. Method B: The colorimetric method involves oxidative reaction of tetrabenazine and it yields green color chromogen. The linear concentrations over the range of 3-15 µg/mL with correlation coefficient of r2 =0.9981 and mean recovery of 99.93% to 100.50%. Method C: The FT-IR method was showed linear over the range of 5-25 µg/mg, with correlation coefficient r2 =0.9998 and mean recovery of 100.75% to 100.91%. The results of tetrabenazine tablets showed good agreement with their label claim. The results of ANOVA declare there was no significant difference between these spectrophotometric methods.
Conclusion: Hence, these spectroscopic methods can be used for routine quality testing analysis of tetrabenazine in pharmaceutical laboratories.
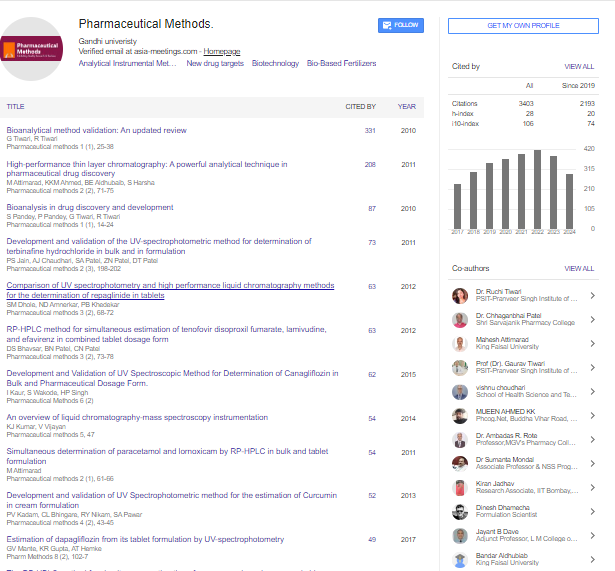
Pharmaceutical Methods received 3403 citations as per google scholar report