Pharmaceutical Methods
Publishing Quality Research & Reviews
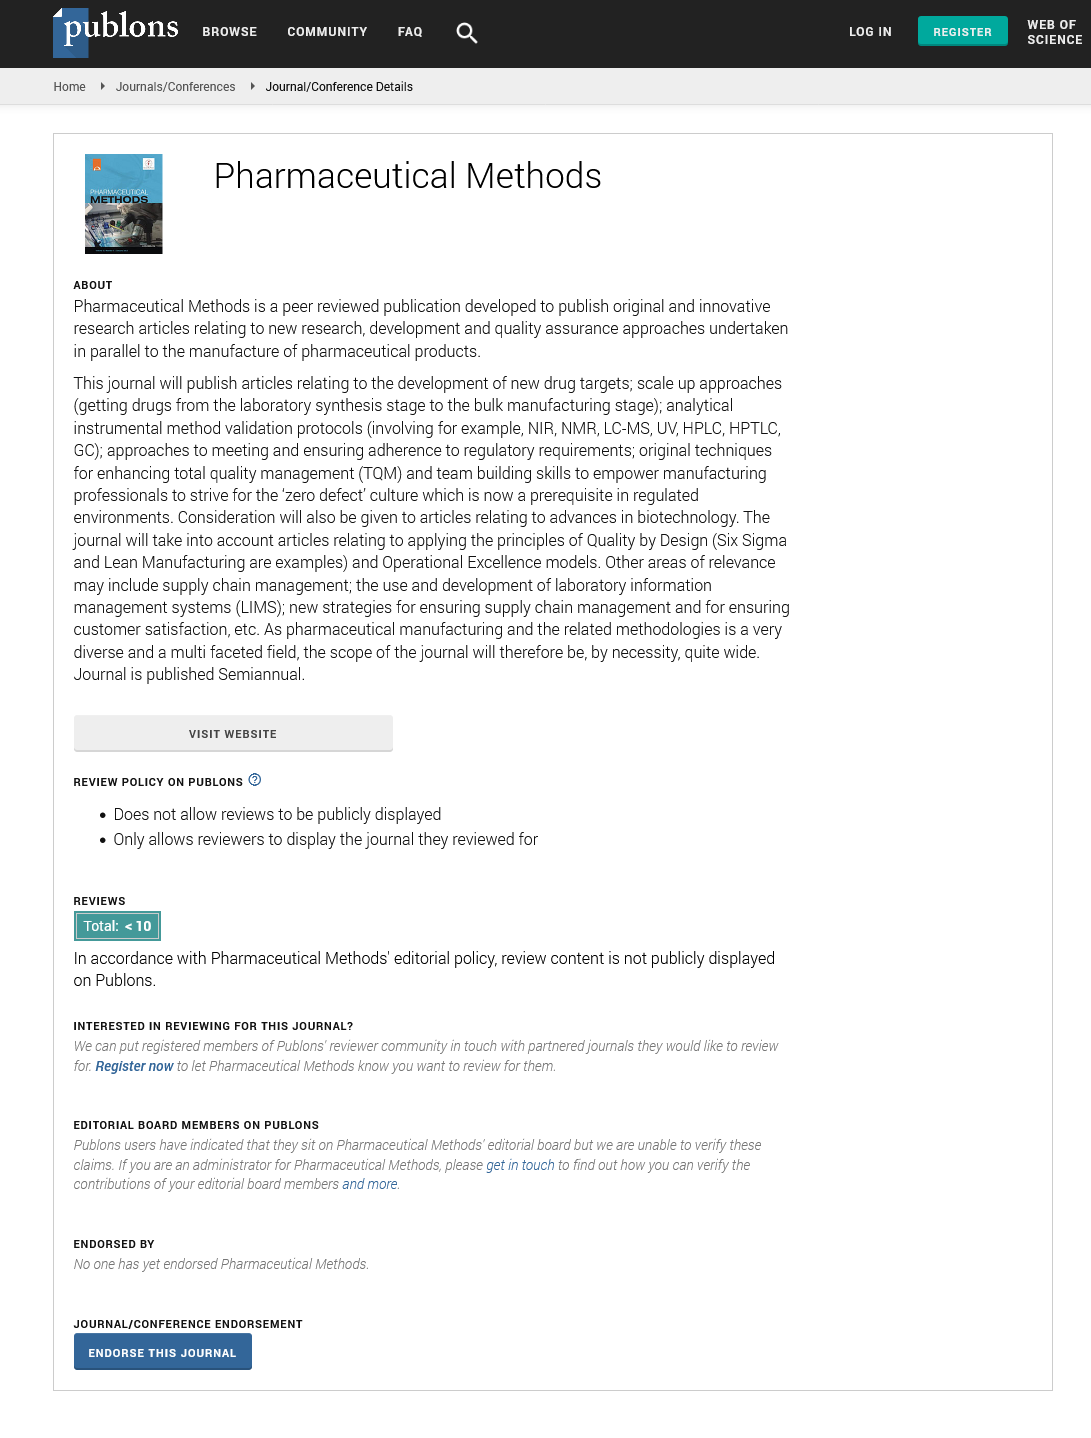
Pharmaceutical Methods
Publishing Quality Research & Reviews
Perspective - (2022) Volume 13, Issue 4
Received: Nov 01, 2022, Manuscript No. PHMETHODS-22-83878; Editor assigned: Nov 04, 2022, Pre QC No. PHMETHODS-22-83878 (PQ); Reviewed: Nov 18, 2022, QC No. PHMETHODS-22-83878; Revised: Nov 25, 2022, Manuscript No. PHMETHODS-22-83878 (R); Published: Dec 02, 2022, DOI: 10.35248/2229-4708.22.13.241
A widely accepted analytical method for capturing the spectra of solid and liquid samples is Near Infrared Spectroscopy (NIR). The NIR spectrum spans 780 nm to 2500 nm. With NIR spectroscopy, less sample is needed for analysis because it is non-destructive and non-invasive. NIR is a quick and non-destructive analytical technique used in chemometrics that may analyse pharmaceutical products in solid, liquid, and biotechnology forms. A harmonic oscillator model with various energy and spatial levels can be used to represent many fundamental vibrations. In NIR spectroscopy, multiple radiation sources are chosen, and at a specific wavelength, various detectors record the spectra of an unknown sample. Discrete wavelength and full spectrum spectrophotometers are the two types of spectrophotometers used in NIR spectroscopy, respectively. For obtaining narrow bands in discrete wavelength, light sources filters like LEDs are employed, whilst diffraction gratings are used for the entire spectrum. The multivariate analysis technique can be used to retrieve the analytical information from NIR spectra. Qualitative analysis also makes use of multivariate analysis.
A widely accepted analytical method for capturing the spectra of solid and liquid samples is Near Infrared Spectroscopy (NIR). The NIR spectrum spans 780 nm to 2500 nm. With NIR spectroscopy, less sample is needed for analysis because it is non-destructive and non-invasive. NIR is a quick and non-destructive analytical technique used in chemometrics that may analyse pharmaceutical products in solid, liquid, and biotechnology forms. A harmonic oscillator model with various energy and spatial levels can be used to represent many fundamental vibrations. In NIR spectroscopy, multiple radiation sources are chosen, and at a specific wavelength, various detectors record the spectra of an unknown sample. Discrete wavelength and full spectrum spectrophotometers are the two types of spectrophotometers used in NIR spectroscopy, respectively. For obtaining narrow bands in discrete wavelength, light sources filters like LEDs are employed, whilst diffraction gratings are used for the entire spectrum. The multivariate analysis technique can be used to retrieve the analytical information from NIR spectra. Qualitative analysis also makes use of multivariate analysis.
By lengthening the grinding period, it was possible to determine from the concentration profiles produced by Self-Modelling Curve Resolution (SMCR) that Pentoxifylline (PTX) was evenly dispersed throughout the tablet's waxy matrix. Pentoxifylline (PTX) grinding time, distribution, and crystal shape alteration were found to be correlated with one another. According to the study, NIR imaging with SMCR analysis might be used to measure the distribution, homogeneity, and change in molecular structure of the constituents.
Citrus juice's soluble solid concentration and pH were determined by using chemometrics and Visible and Near Infrared Spectroscopy (Vis/NIRS). 104 orange juice samples were collected, processed, and their spectra were captured using wavelet packets. Processing spectral data using chemometrics of PLS regression analysis was favoured, and assessment of SSC and pH of orange juice was carried out to demonstrate how chemometrics and NIRS improve the evaluation of data analysis. A dependable and durable method for ensuring the quality of the finished product and the creation of pharmaceutical products is near infrared chemical imaging. This technique's capacity to quickly record a large amount of spectral data is one of its key advantages. For the analysis of the qualitative and spatial information about the ingredient used in the creation of pharmaceutical formulations, the classical least square and multivariate curve revolution model may be utilised. According to PLSR results, the predicted values for the regionally averaged concentrations of the blend's constituent parts are close to those of the mixtures' actual contents. Near-infrared and near-infrared chemical imaging, DSC, FTIR, PXRD, and SEM were used to characterise the material. A powerful tool for characterising and estimating drug and carrier concentrations is the non-destructive method's chemometric application, which uses Near-Infrared Chemical Imaging (NIR-CI) to reveal the homogeneity of the solid dispersion matrix.
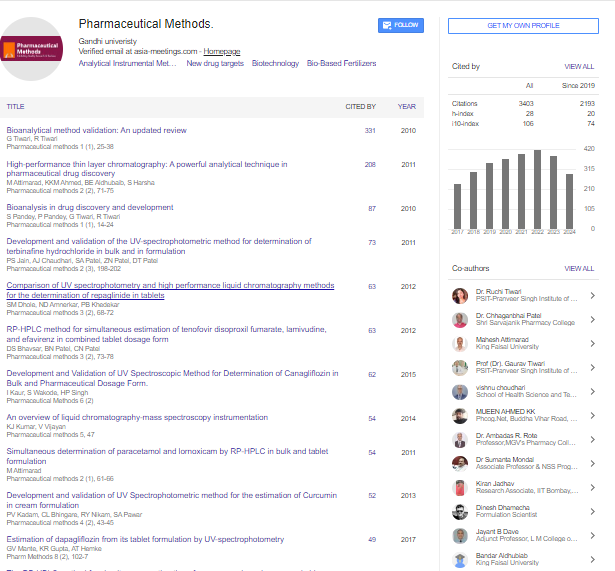
Pharmaceutical Methods received 3403 citations as per google scholar report