Pharmaceutical Methods
Publishing Quality Research & Reviews
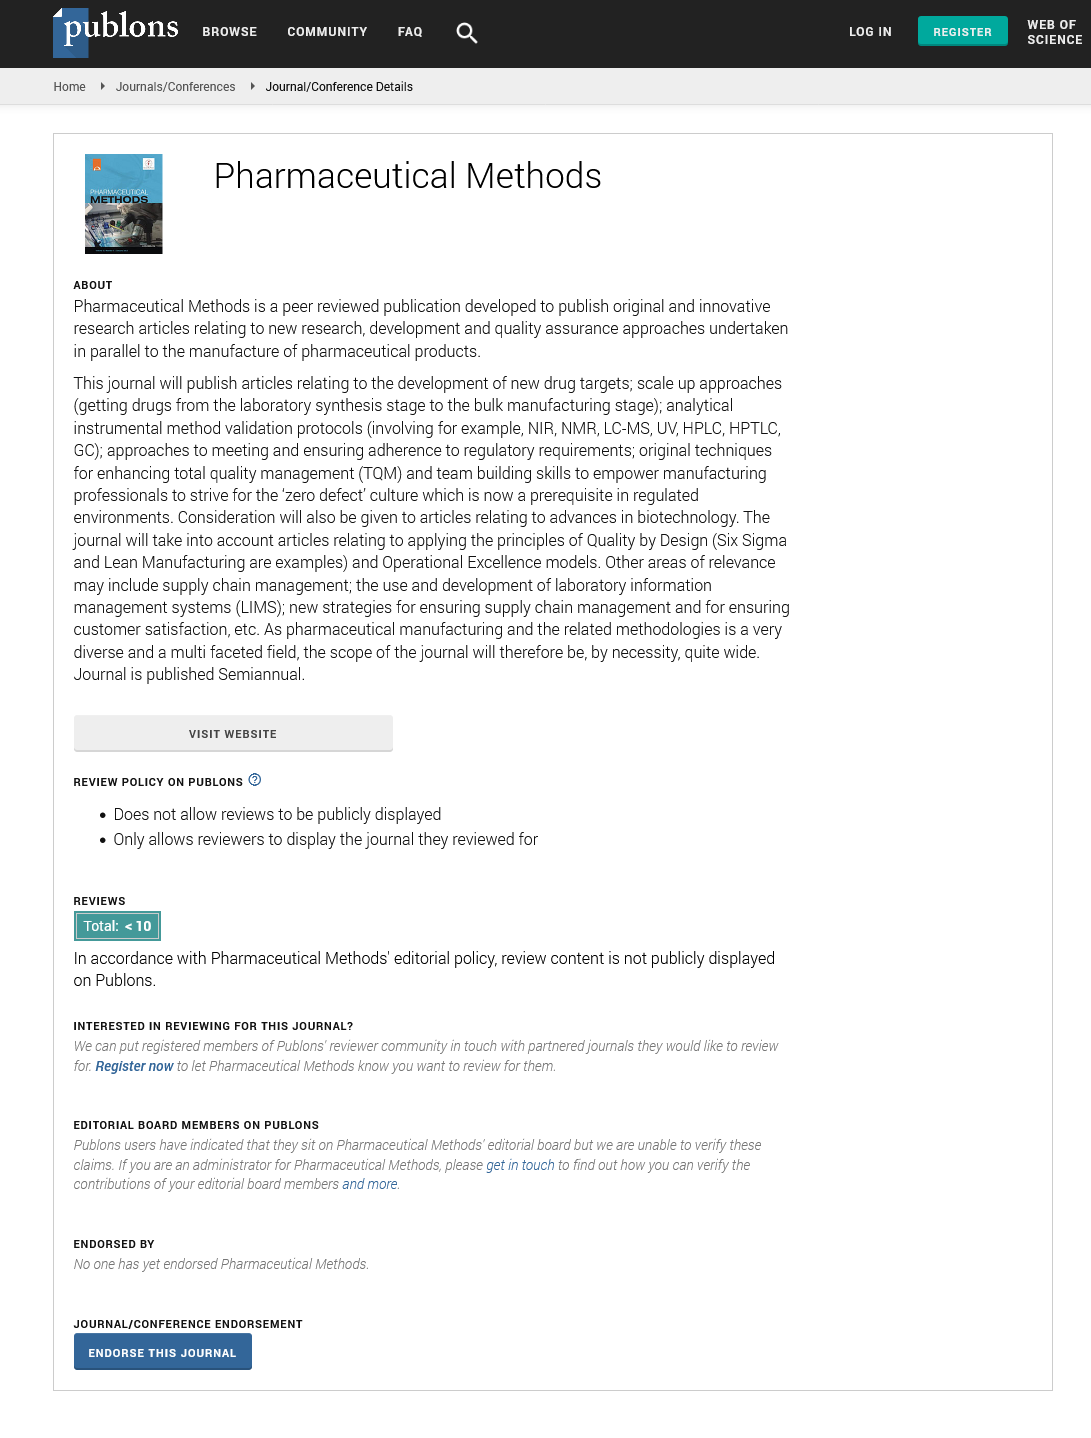
Pharmaceutical Methods
Publishing Quality Research & Reviews
Commentary - (2022) Volume 13, Issue 4
Received: Nov 01, 2022, Manuscript No. PHMETHODS-22-83876; Editor assigned: Nov 04, 2022, Pre QC No. PHMETHODS-22-83876 (PQ); Reviewed: Nov 18, 2022, QC No. PHMETHODS-22-83876; Revised: Nov 25, 2022, Manuscript No. PHMETHODS-22-83876 (R); Published: Dec 02, 2022, DOI: 10.35248/2229-4708.22.13.240
Chemometrics uses a variety of statistical techniques to extract important data from various manufacturing-related activities. In data matrices for bilinear models, variables are organised vertically in each column, and samples are organised horizontally in each row. Principal component analysis and partial least squares are additional categories for bilinear chemometric methods.
Principal Component Analysis (PCA)
A straightforward, nonparametric technique called PCA can be used to extract important information from datasets, spot patterns in the data, and express the data to emphasise both similarities and differences. Within various scientific domains, PCA is used to explore multivariate data compression and reduce dimensionality. Due to its broad applicability to multivariate issues, it is one of the most popular multivariate approaches. PCA is used to reduce the number of variables in a process because it may be used to find a correlation structure of variables during process monitoring and to look at changes in variable correlations. If a number of variables are measured for a number of different sites, things, or people, each variable will have a variance, and the variables will typically be related to one another-that is, there will be covariance between pairs of variables. Data is modified in PCA to depict the same level of variability. The first axis shows the entire variance that is possible, the second axis shows the remaining variance that is possible, and the third axis shows the total variance that is left after taking the first two axes into consideration, again without correlating with either of the axes. The weights of the new axes, or dimensions, are determined by how much of the overall variance they describe and are uncorrelated with one another.
Partial Least Squares (PLS)
A well-known class of techniques called Partial Least Squares (PLS) is used to model the relationships between various sets of observed variables using latent variables. Wold and colleagues created projections of the observed data to its latent structure using PLS. The fundamental premise of the PLS method is that by combining regression, dimension reduction techniques, and modelling tools, it modifies relationships between sets of observed data by a small number of latent variables. Generally these latent vectors maximise the covariance between different sets of variables. Like Principal Component Analysis (PCA), PLS is comparable to Canonical Correlation Analysis (CCA) and can be used as a tool for discriminating and a method for dimension reduction. It can also be related to other regression techniques such as Principal Component Regression (PCR), Ridge Regression (RR), and Multiple Linear Regression (MLR); these techniques can all be grouped together under a general strategy known as Continuum Regression (CR). The PLS approach is widely used in the field of chemometrics because it can handle a variety of chemical data processing issues. However, PLS tends to produce large prediction errors when there is significant nonlinearity, necessitating the use of nonlinear calibration methods like Nonlinear Partial Least Squares (NPLS), Locally Weighted Regression (LWR), Alternating Conditional Expectations (ACE), and Artificial Neural Networks (ANN).
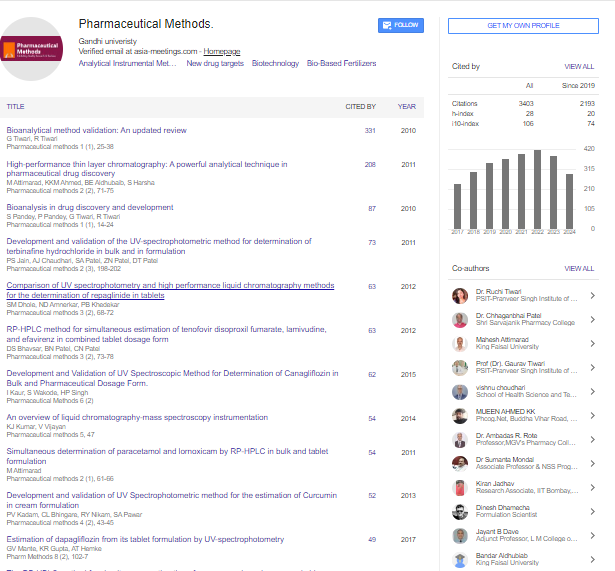
Pharmaceutical Methods received 3403 citations as per google scholar report